Using DC/DC units as examples, the authors continue to look at different ways to dissipate heat, explain the specifics of using power reduction curves, and give recommendations for selecting units from different manufacturers from a thermal performance perspective.
It’s a tough business to talk about the thermal intricacies of unit applications. Let’s recall the main points from the first part of our article and talk about new points. It has been defined that everything “bad” starts with the efficiency. Indeed, the heat loss depends first of all on the efficiency:
Pdiss = Pout / η – Pout`
where Pout – output power of the unit; η – unit efficiency.
Efficiency value is non-linear and depends on the rated output power of the unit, on the power factor, on the input and output voltages of the unit, and even on the unit’s case temperature.
The variation in efficiency can be significant, and the power loss grows very fast with a decrease in efficiency – for example, a 10% change in efficiency from 0.8 to 0.7 results in a 1.7-fold increase.
For low power units, it is characteristic to use a simple inverse converter structure, which is not the most energy efficient. Therefore, the efficiency for 5 V output (we will always use this value as the most typical one) is likely to be in the range of 0.75-0.86 (this article does not consider units with synchronous rectifiers, which have their own specifics). Efficiency values of 0.75-0.78 are typical of units of low power of 3-10 W, operating in a wide range of housing temperatures (from -60 to +85 … +100 °С). Particularly noticeable decrease in efficiency in power units operating in the range of voltage changes 4:1 or more, as well as with high values of the maximum temperature of +100 … +135 ° C, when the work occurs at a low fill factor, dramatically increases the channel resistance of field transistors, as well as hundreds and thousands of times the leakage currents of Schottky diodes. Even such a reputable firm as Interpoint, for a 125-degree unit at 5 W, indicates a modest efficiency = 0.68-0.7.
For units of higher power efficiency grows, especially with the already justified in this case transition to a more complex and efficient structure of direct pass converter, but local overheating in the body of the unit grows, the unevenness of heat distribution in the volume increases. As a result, we can expect an efficiency of only 0.8-0.86 for units with power over 20 W, and for a wide range of temperatures and input voltages the efficiency values of 0.78-0.82 are more realistic.
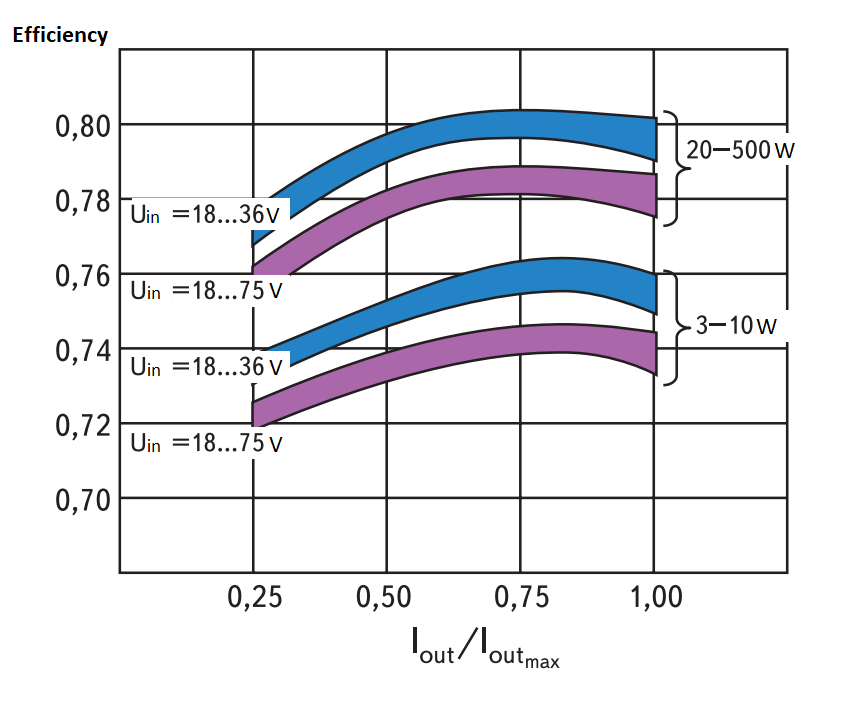
Fig. 1 – Typical dependencies of efficiency on output current
First conclusion: start choosing a suitable power unit by examining the dependence of its real efficiency on various electrical and temperature operating conditions. Figure 1 shows typical efficiency vs. output current for 3-10 W and 20-500 W units. These universal data are suitable for almost all types of DC/DC and AC/DC units (which also have the notion of a wide mains voltage range).
The next important parameter of the power supply unit is the maximum thermal resistance Rmax of the heat dissipation system, which determines the overheating of the unit over its environment:
Rmax = (Tmax – Tamb) / Pdiss
where Tmax – maximum permissible temperature of the unit’s case; Tamb – ambient air temperature during the unit’s operation (it is also necessary to take into account heat dissipation of the elements and blocks neighbouring with the unit).
This definition is more “bad” for a developer than good. The point is that almost all of the output power of the units, which goes into the supplied equipment, as a rule, is dissipated in a limited volume. Therefore, in such cases it is not its own overheating due to not very high efficiency that is terrible for the unit, but the thermal background created by its consumers in the enclosed volume. A common mistake of developers is to ignore their own heat of the equipment, when the ambient temperature is taken as the basis.
Another problem is that the unit itself contributes to the increase in ambient temperature. And here the best recommendation can only be a full-scale experiment based on a practically established thermal equilibrium. Figure 2 shows the heat fluxes around the power unit in a closed volume temperature cabinet.

Fig. 2 – Heat flows around the power unit
The obtained value of Rmax must first be compared with the thermal resistance of the “unit’s enclosure-environment” Rcase-ambient, the value of which is given by the power supply unit manufacturers in technical documentation, for example, in the specifications. If Rcase-ambient is less than calculated, there is no need for an additional heat sink for the unit – the surface area of the unit itself is sufficient for heat removal, if there are no obstacles for free circulation of ambient air.
Finally, typical curves of maximum power output reduction of units without additional heat sinks as a function of ambient temperature (“thermal curves” or Derating curves) are very useful.

Fig. 3 – Heat curve of a real power unit with low efficiency
The horizontal axis shows the ambient temperature, and the vertical axis shows the maximum power output of the power supply unit at which the case temperature will not exceed its limit. The horizontal section of the thermal curve corresponds to the maximum long-term power of the power supply unit, and the unit’s case temperature in this section has approximately the same overheating ΔT relative to the ambient temperature Tamb , equal to ΔT = Rcase-ambient * Pdiss.
We would like to draw readers’ attention to the fact that the descending part of the thermal curve in the area of higher ambient temperatures is characterized by the same temperature of the housing, equal to Tmax, in this case +105 °С.
Understanding the meaning of the point on the temperature axis, to which the falling part of the thermal curve tends (the point of zero power To), allows you to assess the level of the element base used in the unit and the complexity of the applied technologies, as well as to identify obvious mistakes made with a poor approach to the study of thermal modes of manufactured products. It should be noted that the point of intersection of the thermal curve with the temperature axis (on the considered graph +85 °С) cannot be the point Tmax, if there is a non-zero output power at this point. Such a coincidence always indicates unreliable information.
From the thermal curve, you can calculate the thermal resistance value Rcase-ambient, considering that at the point where the output power starts to decrease, the case temperature is equal to the maximum allowable temperature:
Rcase-ambient = (Tmax – Tderating) / Pdiss
where Tderating is the ambient temperature at which the output power decrease begins.
Next, let’s consider the real possibilities of the unit’s operation at the maximum enclosure temperature declared by the manufacturer.
Each unit usually has internal thermal protection in the form of a thermocouple (usually a special chip) located in the vicinity of the unit’s most sensitive element, next to the power transistor or PWM controller chip. Naturally, the thermocouple reacts to the temperature at the point in the internal volume of the unit where it is located. However, the maximum temperature of the unit’s enclosure, depending on the hardware design, can differ dramatically from the temperature of the fuser.

Fig. 4 – Power unit with “bad” characteristic design features of hardware applications
Fig. 4 shows the unit in sectional view with unfortunate design features of the application in the hardware. The unit itself is mounted on a plastic base with low thermal conductivity, the outputs of the unit are connected to the hardware with flexible wires, the heat sink for the unit is not used, because the consumer is sure that he will load the unit at a reduced power, and in case of unintentional overheating of the unit from its own heat generated by the unit will trigger the thermal protection in the unit. The figure shows that due to the small thickness of the unit housing, a thermal concentrator is formed, a heat spot on the housing, because the heat “does not want” to spread along the thin-walled structure. It is in the heat spot that the maximum temperature of the unit housing will be. As a result, the product will be able to work reliably only at unacceptably low ambient temperatures. (The authors do not recommend this use of power units!)
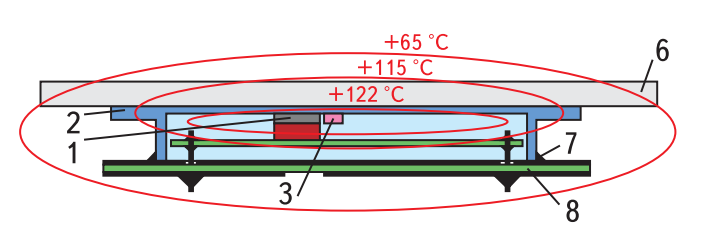
Fig. 5 – Power unit with correct design features applications in hardware
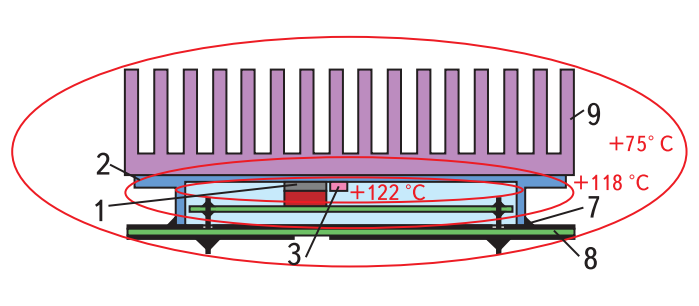
Fig. 6 – Power unit with heatsink and printed circuit board (the best option)
In Figs. 4-6 are labeled: 1 – power transistor; 2 – unit housing; 3 – temperature sensor; 4 – plastic base; 5 – flexible conductors; 6 – heat equalizing plate; 7 – soldering location of unit housing to PCB; 8 – PCB; 9 – heat sink.
Fig. 5 shows the unit with more correct – “good” design features of the application in hardware. The unit itself is soldered to a sufficiently thick (2.5 mm) double-sided PCB made of FR4 material with plating – foil 0.15 mm, on which almost the entire area under and near the unit is occupied by plating. The body of the unit is seated close to the printed circuit board until it touches the metallization and is additionally soldered to the metallization. A heat equalizing copper (aluminum) plate (thin-walled partition of the hardware cabinet) is placed on the upper side of the housing with a heat transfer paste. As a result, the thermal concentrator disappeared, the overheating of the unit decreased, which at the same maximum temperature of the case allowed to raise the maximum ambient temperature to the value of +65 °С.
Finally, Fig. 6 additionally shows the heatsink with a thick base, a solution with “excellent” design features. As a result, overheating of the unit became even lower, and the maximum ambient temperature increased to the value +75 °C.
To explain the PCB drawings, we give the topology recommended by Alexander Electric for units with maximum enclosure temperature of +125 °С (Fig. 7, 8).
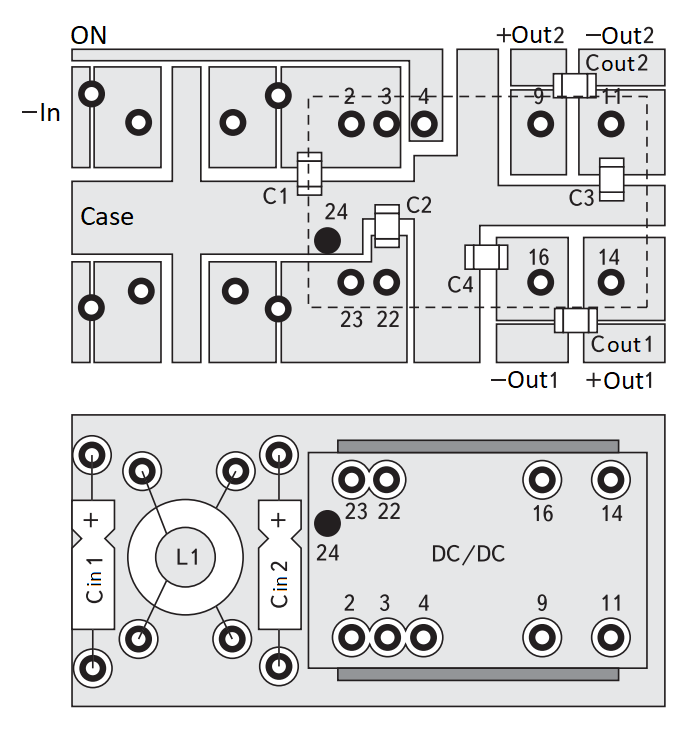
Fig. 7 – PCB topology for module by Alexander Electric.
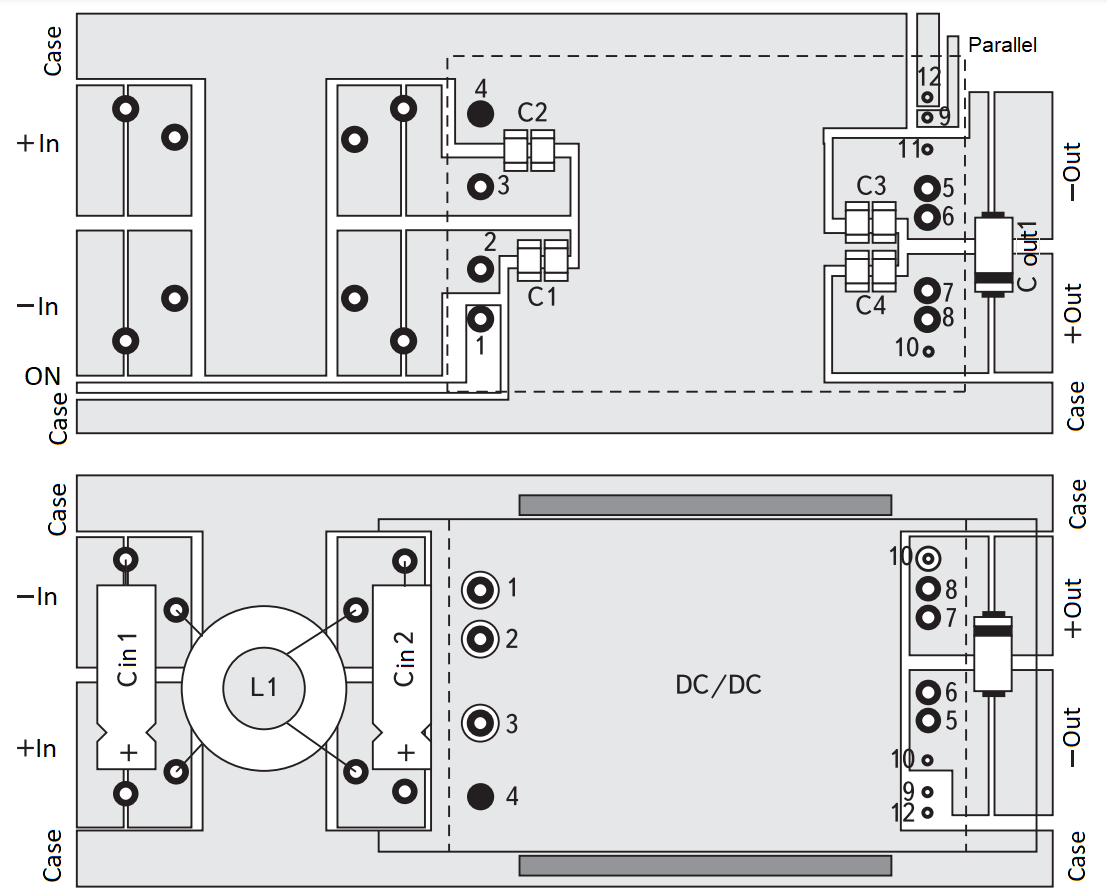
Fig. 8 – PCB topology for module by Alexander Electric.
That is, in fact, all the “bad” news.
“Good” news (which, as we know, was good only for the commander) is this. We have a unique opportunity to show our esteemed readers the usefulness of the above techniques for actually determining the thermal performance of power units of any firm advertising its achievements, regardless of how reliable the advertising information is.
The given information materials contain thermal curves with possible non-principled errors in Fig. 9.
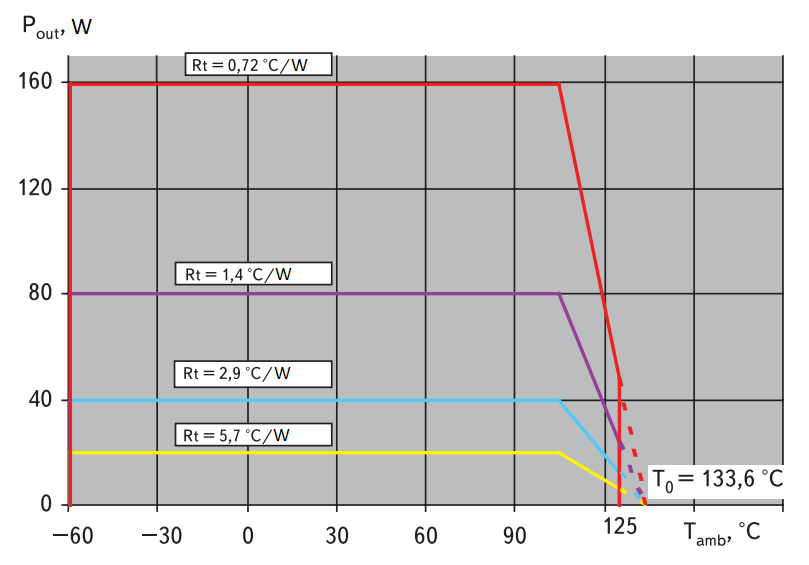
Fig. 9 – Declared heat curves
Figure 10 shows our calculated real thermal curves when using heat removal through the printed circuit board – conducted field experiments showed a good coincidence of practice and theory.

Fig. 10 – Real thermal curves based on experimentally measured thermal resistances of cases, minimized by using the thermal conductivity of the PCB
The attentive reader should compare Fig. 9 and Fig. 10 and draw his own conclusions about how different the advertising may be from the reality. For example, a temperature of 90 °C is advertised to produce an output power of 20, 40, 80, and 160 watts, respectively. In reality, the consumer buying such a product is not likely to get more than about 16, 18, 30, and 42 watts, respectively. The error in expectations can be as high as 300%, and what is that for a hardware manufacturer whose deadline to roll out production has passed?
Useful results of the methods outlined by the authors

