What is good, and what is bad…
It’s essential to know true efficiency values of one’s power supply unit (also converter). Without these values it’s not possible to appropriately choose primary power source, to calculate power loss inside the power unit itself and to come up with correct cooling method. Exactly efficiency determines temperature increase of the DC/DC or AC/DC converter relative to ambient environment, while any extra 10 degrees decrease MTBF by approximately twice!
What a good life it would be for designers if the efficiency wasn’t only known but also constant. However it varies, in particular in mentioned isolated converters with wide input voltage range.
What does efficiency depend on? On many factors – converter topology, technical category of components, unit’s dimensions, electrical, environmental and even mechanical properties, and very much on designers‘ talents and used know-hows. What can worsen efficiency though, it’s mainly incorrectly, inappropriately placed requirements of technical specifications.
I well remember the time when the requirements for devices located inside the protected volume of the entire product were dictated by the general tech. specification made for the whole product! Imagine a unique situation from the customer – one had to prove that one’s power supply unit could work for 10 minutes at an ambient temperature of 300 degrees! And we did prove and carry out extremely expensive tests, when all epoxy adhesives became coal-black and the solder would begin melting from the leads and the case. And the arguments that 300 degrees was a result of aerodynamic heating of the exterior of the product, and that such temperature, though recorded in the tech. spec., couldn’t quickly reach the inside of the product and in 10 minutes heat up the unit through the polyurethane foam filling, were considered unconfirmed demagogy. Well, some details were made up, however the story is based on real events! So, if „ambient temperature“ is mentioned during assignment, specify meticulously – who and what is surrounded by both the environment and temperature…
So on to the obstacle, that is the essay!
Ideal situation: you’re strongly inspiring hope in a manufacturer for the big order and agreeing on increased price – as a result, on your request, you’re given an efficiency-load graph for your potential converter. 99 % sure, it’s something similar to what is shown in fig. 1.
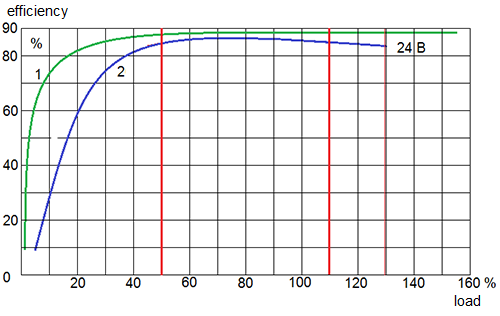
Fig. 1: almost ideal (1) and actual (2) efficiency curves for an isolated converter
Commentary: i.e. typical efficiency curves are shown for output voltages of 5 VDC and 24 VDC. Quite common case – efficiency raises quickly for output load 10-20 % of nominal and reaches 88-89 %, which is an excellent indicator, even for the topologies with synchronous rectification, granted when one is dealing with low-power tier of units.
Due to many reason units with such characteristics are impossible to buy. Personally, obtain one laboratory prototype with such parameters is possible. However, actually mass-produced converters have significant variation of components properties. Variation in the resulting characteristics of the coil elements – transformers and a choke, which surely would cause get influenced by temperature in some areas inside the structure on the power loss, etc., up to the imprecision of the measuring devices. In general, a decent manufacturer will show you an efficiency curve taking into account all the factors, i.e. with a certain margin of underestimation, real curve. One similar to curve #2 in fig. 1.
Curve #2 is a good typical example. What’s left is to determine mathematical estimation of output power, that is output long-term power, and use associated efficiency value when designing equipment parts and heatsink. In most cases, efficiency of optimally chosen power supply would be maximal at roughly 70 % out nominal output load of the unit, which is a good loading in many regards. Firstly for the reliability, which determines what power supplies to obtain. If your expected consumption is 10 W, it’s better to use 15 W converters.
Characteristic graph areas – where efficiency is almost constant for load of 50-110%, with efficiency variation of 2-3 %. Load of 110 % of output nominal power is stated for practical case of when overload protection is tripped – counting on successful long-term operation at such load without warning the manufacturer (when ordering) would be a mistake.
Part of curve #2 for loading of 110-140 % is necessary to account for prediction of technological spread of protection threshold and offset created by factors like temperature, input voltage and other changes. For the designers itself, this part of the curve signifies an adequate margin in the circuitry and construction of the converter.
Thus, from the fig. 1 one is assured of having efficiency above 84 %. However real life can bring one issues when considering other, not immediately obvious, factors influencing efficiency. Let’s consider one of the typical cases – the effect of variation in supply input voltage, shown on fig. 2.
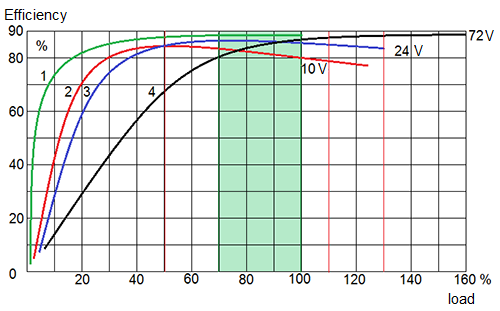
Fig. 2: ideal (1) and actual (2, 3, 4) eff. curves for isolated converter at different input voltages.
Unfortunately, you will see that the optimum load area of the converter has drastically reduced to 70-100 %, and hopes for high efficiency have collapsed. Now one must use no more than 80% eff. to calculate heatsink parameters!
I don’t even want to write about the effect of temperature on efficiency, it is bad. Sometimes touching are the manufacturers‘ datasheet graphs, in which the conditions and temperature for graph are not stated (we also try not to state so as not to spoil your mood at work)…
In conclusion, I will give a small example to show the meaning of an expression – „what is good, and what is bad“.
Firstly, many system and equipment specialists and instructors do not know how to determine the thermal power dissipation in the converter. Without long thinking, they take 100% and in their mind subtract measured efficiency, for example 80 %, and then consider the remaining 20 % as losses, as heat, based on which the cooling system should be calculated. Here lies the issue – in such example power loss doesn’t equal 20 % but 25 %! However, that’s for beginners. I’m completely sure that You would recall the correct power dissipation formula even in your dream:
Pdiss = Pout . (1-Eff) / Eff, and then you’d correctly calculate the heatsink.
Tips:
General constructor of AEPS-GROUP Alexander Goncharov.

